5 Data pre processing
After loading the data, the creation of a flow map with Arabesque can be broken down into the following main steps:
- Importing flow datasets (links and/or nodes) 2. Processing flow datasets (indicators calculation, …)
- Geographical data computing : designing the map background (layers, …)
- Cartographic symbolization : designing the flowmap signs (arrows, …)
- Statistical data computing (filtering, …)
- Export
The links and nodes datasets are automatically modified when importing and Arabesque computes different indicators and a default flowmap is suggested.
5.1 Indicators on links
For the moment, only the euclidean distance between the origin and destination entities is calculated.
5.2 Indicators on nodes
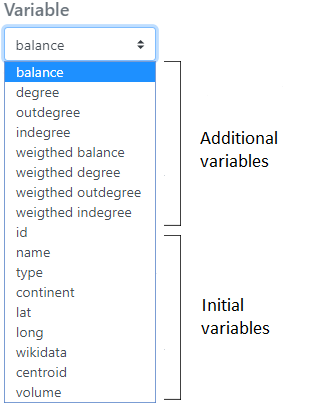
A list of Various simple and weighted indicators are calculated on the nodes (with reference to the Social Network Analysis (SNA) theory are proposed.
balance : difference between the number of in and out degrees.
outdegree : number of outgoing links from a places
indegree : number of ingoing links from a places
weigthed Balance : difference between the number of in and out degrees weighted by the flow value (.ie. volume)
weigthed degree : difference between the number of ingoing and outgoing links weigthed by the flow value (.ie. volume).
See below the additional indicators automatically calculated on the nodes of the RIcardo data
See below the indicators that have been automatically computed (ie the additional variable) on the nodes of the RIcardo data.
These indicators can be downloaded in . csv format (see Export and Save sections).
Loading links and nodes data into Arabesque leads to the creation of a default map, which is placed in the center of the interface.
5.3 Suggested default flowmap
Loading data in Arabesque leads to the creation of a default map to avoid visualizing a “spaghetti effect” when entering the application ; all the defined parameters can then be modified during the exploration.
By default, the links are represented in shades of blue and the nodes in red. The map is presented in the WGS84 projection, according to the lat/lon coordinates declared during the import.
Except in the case of loading a projected geometry as input, the map is presented in WGS84.
Hereby is the Ricardo’s dataset default map with global statistic of the percent of links versus the percent of volume of flows and nodes.
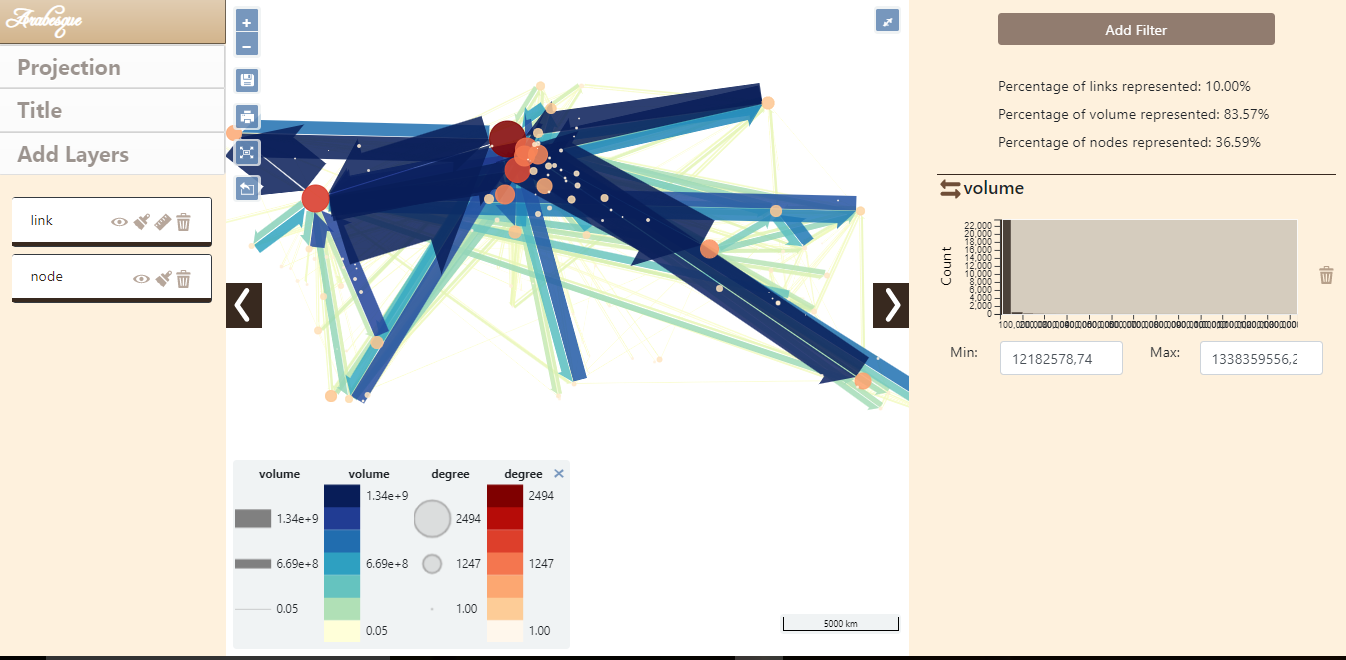 For all default map, only the 10% most important links (in value) are represented and symbolized (see the automatic legend) according to their intensity (the flow variable entered at import).
The corresponding nodes are symbolized according to their degree (variable calculated automatically during the import).
For all default map, only the 10% most important links (in value) are represented and symbolized (see the automatic legend) according to their intensity (the flow variable entered at import).
The corresponding nodes are symbolized according to their degree (variable calculated automatically during the import).